How-To
Solar Panels for Self-Build Homes in the UK
Self-build is the best opportunity to integrate solar properly — before walls go up and cables get buried. Here is…
September 30, 2026
Read more →
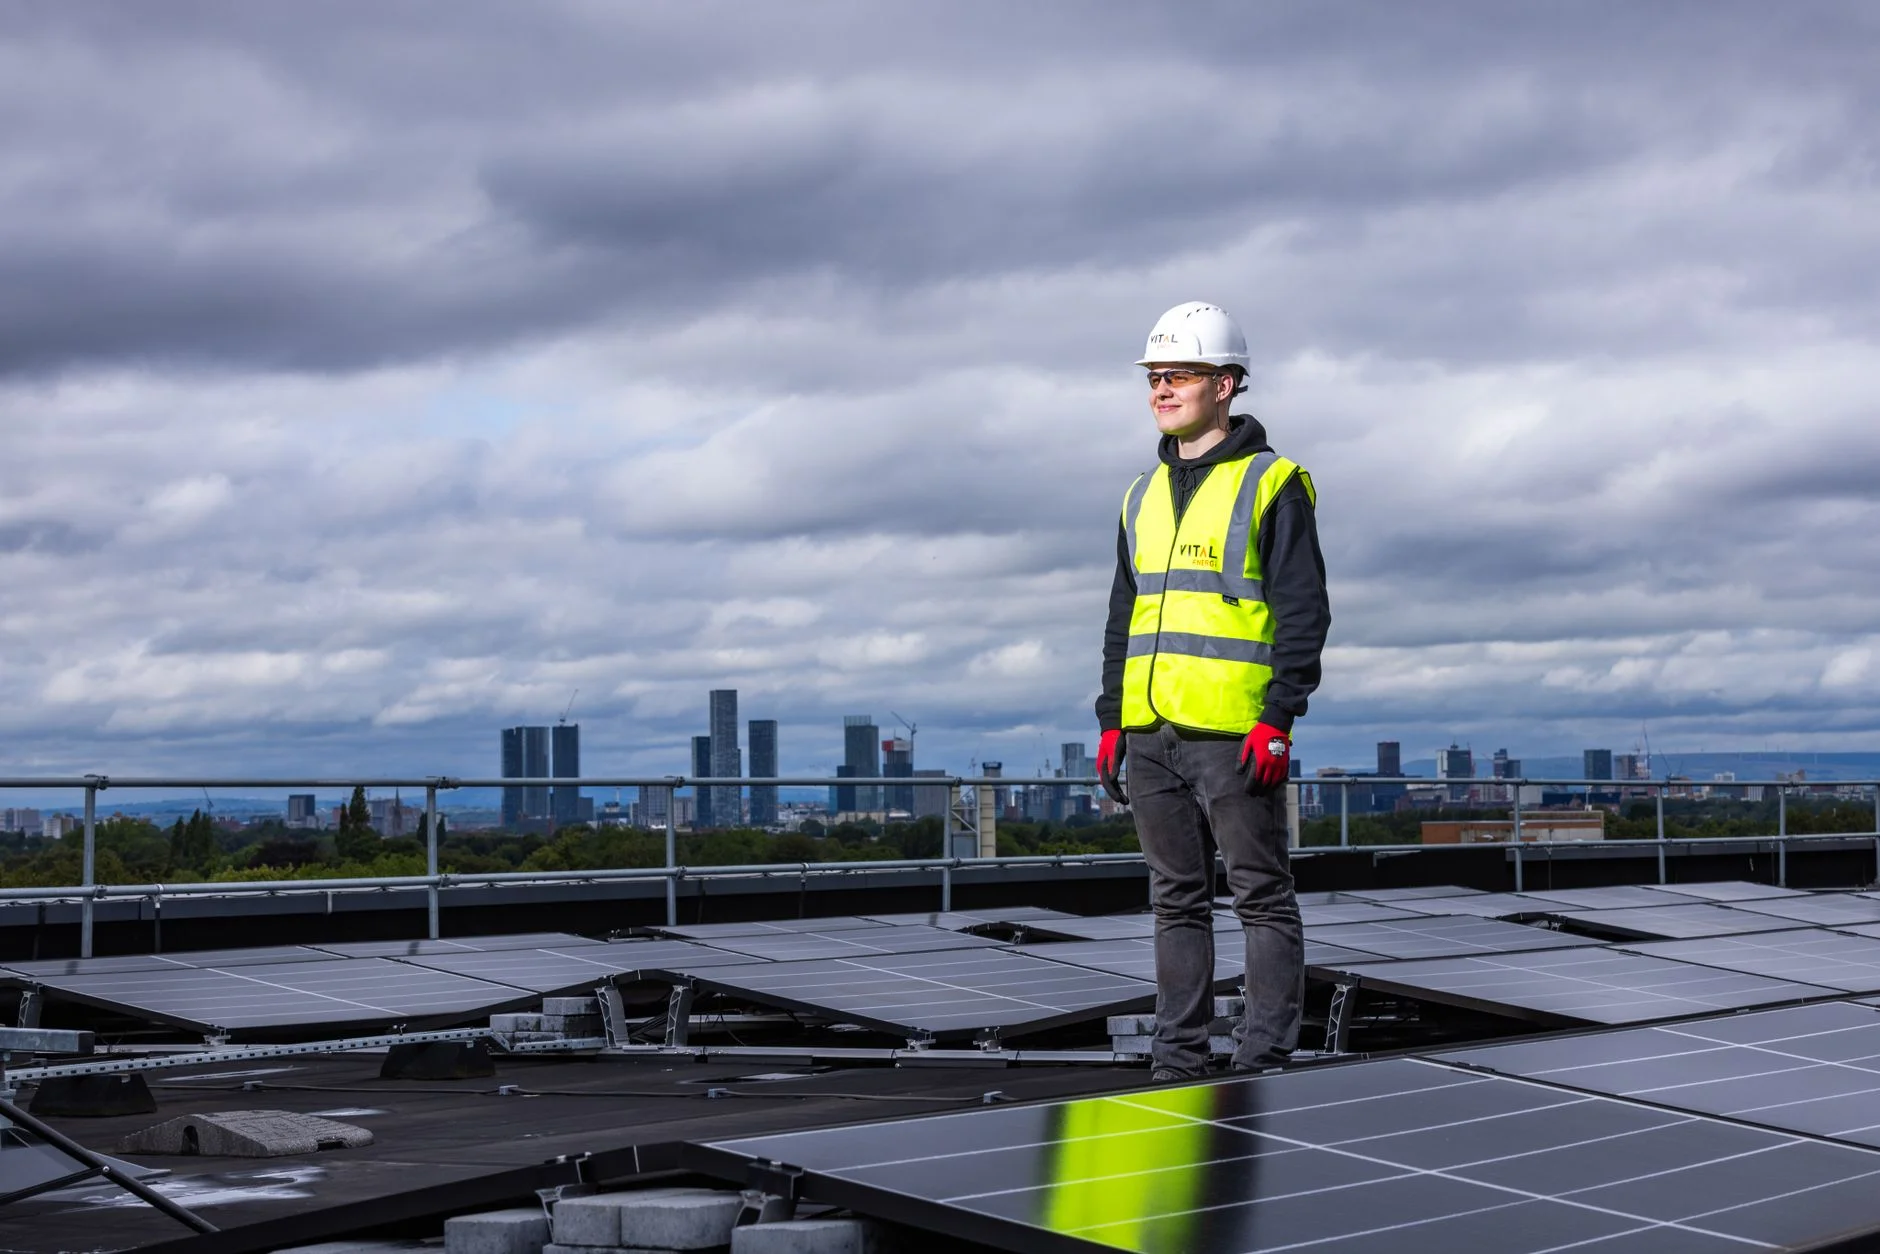
Solar panels working in cloudy weather is the single most common misconception that stops UK homeowners from going solar. The assumption that Britain’s grey skies make solar panels pointless is simply wrong — and the numbers back that up clearly. The UK has over 23 gigawatts of installed solar capacity generating meaningful electricity across all four seasons. Understanding why requires a quick look at how solar panels actually work.
Solar panels generate electricity from photons — particles of light — not from heat or direct sunshine. When photons hit the silicon cells in a solar panel, they knock electrons loose, creating an electric current. This process works with all forms of daylight, including the diffuse light that reaches the ground on an overcast day. Clouds scatter and diffuse sunlight but do not block it entirely.
On a heavily overcast day, a solar panel might generate 10–25% of its peak rated output. On a lightly cloudy or hazy day, that rises to 50–80% of peak. For comparison, even full direct sun delivers varying output depending on the angle of the sun to the panel — a panel rated at 400W peak will only reach that maximum under ideal lab conditions (direct midday sun, 25°C cell temperature, precise panel angle). In real UK conditions in summer, panels regularly hit 70–85% of their rated output on bright, partly cloudy days.
On a heavily overcast day, solar panels generate 10–25% of their peak output. On a lightly cloudy day, 50–80%. Britain’s diffuse light still adds up to meaningful annual generation.
There is also a counterintuitive effect worth knowing: on a cool, bright spring day with high, wispy cloud, panels can briefly exceed their nameplate rating. Solar cells are more efficient at lower temperatures, so a 5°C March morning with clear-ish skies can produce more power per hour than a 30°C July afternoon. The UK climate, with its mild temperatures and reasonable summer irradiance, is actually not a bad environment for solar panels at all.
The relevant measure for solar generation is peak sun hours — a standardised unit representing the equivalent number of hours per day at peak irradiance (1,000 W/m²). The UK receives between 700 and 1,200 peak sun hours per year depending on location. For context, southern Spain receives around 1,900 peak sun hours per year. The UK is not a solar superstar, but it is far from a solar dead zone.
| Region | Annual Peak Sun Hours | Est. Output (4 kWp System) |
|---|---|---|
| South East England (Kent, Sussex) | 1,150–1,200 | 4,200–4,400 kWh/year |
| South West England (Cornwall, Devon) | 1,100–1,180 | 4,000–4,300 kWh/year |
| East Anglia | 1,050–1,120 | 3,800–4,100 kWh/year |
| Midlands | 950–1,050 | 3,400–3,800 kWh/year |
| North West England | 900–980 | 3,200–3,600 kWh/year |
| Yorkshire and North East | 900–970 | 3,200–3,500 kWh/year |
| Scotland (Central) | 800–900 | 2,900–3,300 kWh/year |
| Scotland (Highlands) | 700–820 | 2,500–3,000 kWh/year |
These figures are based on Energy Saving Trust solar generation data and standard photovoltaic yield modelling. Even Scotland’s Highlands — the least sunny part of the UK — receives enough irradiance to make solar economically viable for most homeowners, particularly when combined with a home battery and a smart export tariff.
The UK’s solar generation profile is highly seasonal, which is important to understand when planning your usage and storage strategy. Around 70–75% of a UK solar system’s annual generation happens between April and September. December and January are the lean months — a south-facing 4 kWp system in the Midlands might generate only 100–150 kWh in December, compared to 450–550 kWh in June.
| Month | Typical Generation (4 kWp, Midlands) | Daily Average |
|---|---|---|
| January | 100–130 kWh | 3–4 kWh/day |
| February | 140–180 kWh | 5–6 kWh/day |
| March | 250–320 kWh | 8–10 kWh/day |
| April | 350–420 kWh | 12–14 kWh/day |
| May | 400–480 kWh | 13–16 kWh/day |
| June | 430–530 kWh | 14–18 kWh/day |
| July | 420–510 kWh | 14–17 kWh/day |
| August | 370–450 kWh | 12–15 kWh/day |
| September | 280–350 kWh | 9–12 kWh/day |
| October | 170–220 kWh | 5–7 kWh/day |
| November | 100–140 kWh | 3–5 kWh/day |
| December | 80–120 kWh | 2–4 kWh/day |
The implication of this seasonal profile is that solar panels are excellent for reducing bills in summer but are not a complete solution for winter energy costs. Most solar households still need grid electricity in winter, particularly for heating. Combining solar with a heat pump and battery storage improves winter economics — the heat pump’s efficiency means each unit of electricity goes further for heating, even when solar generation is low.
Myth: Solar panels don’t work in the UK because it’s too cloudy.
Reality: Germany — which has broadly similar solar irradiance to the UK and significantly more cloud cover in some regions — is one of the world’s largest solar markets per capita. The Solar Trade Association reports that the UK solar industry has consistently generated record annual output each year for the last decade. Irradiance is a factor in sizing a system correctly — but it does not make solar unviable.
Myth: Solar panels need direct sunlight to generate power.
Reality: As explained above, solar panels respond to all forms of daylight. On a bright but cloudy UK day, panels generate 50–80% of their clear-sky output. On a heavily overcast January day, they generate 10–25%. Both are non-zero — and on annual totals, those winter contributions add up.
Myth: Solar panels stop working in rain.
Reality: Panels work in rain — just at reduced output due to cloud cover. Rain is actually beneficial because it washes dust and pollen off the panel surface, which can otherwise reduce output by 2–5% over a dry summer period. UK panels rarely need manual cleaning precisely because the regular rainfall keeps them reasonably clean.
Myth: Solar panels are useless in winter.
Reality: They generate less, but far from nothing. A typical UK solar system generates around 10–15% of its annual output in November, December, and January combined. On a bright winter day, a 4 kWp system in the south of England might still generate 8–12 kWh — enough to cover a household’s daytime electricity use. The economics are less compelling in winter, but the contribution is real.
Yes — but perhaps less than you might think. The difference in annual solar generation between Cornwall and Central Scotland is roughly 30–40%. That is meaningful when calculating payback periods, but it does not make solar unviable in Scotland. A Scottish homeowner installing a slightly larger system can achieve similar bill savings to a Cornwall homeowner with a smaller system, though their capital cost will be higher.
A more important factor than latitude is roof orientation and local shading. A south-facing roof in Edinburgh will outperform a heavily shaded north-facing roof in Brighton. Roof factors — pitch, orientation, shading — typically have a larger impact on real-world generation than latitude within the UK. Use our solar savings calculator to input your specific postcode, roof orientation and usage to get a location-specific estimate.
For a complete picture of what solar can realistically save you, including how battery storage affects seasonal economics, see our home battery storage guide and our UK solar panel costs guide. The UK climate is far from the worst in the world for solar — and with energy prices where they are, the economics work across virtually the entire country.
The Ofgem Smart Export Guarantee ensures that even the electricity your panels generate on a dull January afternoon, if exported to the grid, earns you a payment — meaning every unit your panels produce has value, year-round, regardless of the cloud cover.
Self-build is the best opportunity to integrate solar properly — before walls go up and cables get buried. Here is…
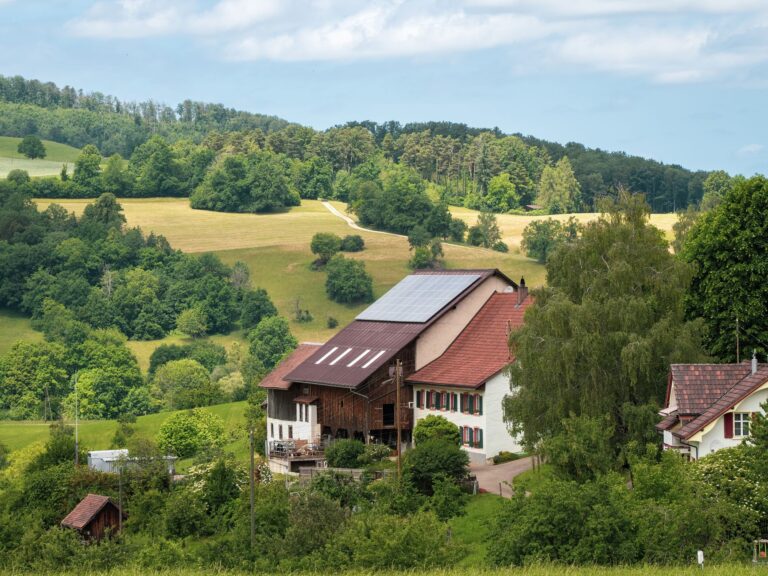
Garage and outbuilding roofs are often better solar locations than the main house — south-facing, unshaded, and away from chimney…

A solar immersion diverter routes excess solar electricity to your hot water cylinder, cutting your gas or electric immersion costs.…